Trust, But Verify: Our Approach to Due Diligence for Joint Ventures
Due diligence for joint ventures is more important than due diligence in an M&A context and requires an approach that exceeds traditional M&A due diligence.
Why charting a Capabilities Map of the venture landscape is critical for JV Boards, management, and shareholder governance teams

JANUARY 2015 — At their essence, joint ventures are an assembly of capabilities of the co-venturers and, over time, the venture itself. For example, the North American Coffee Partnership is a billion-dollar joint venture between Starbucks and Pepsico to bring bottled frappuccinos and other ready-to-drink coffee products to consumers. The JV is a confluence of capabilities, with each partner performing critical activities along the venture value chain, from product development, to merchandising, to sales and distribution.
Dynamically delivering capabilities is also a feature of Ormen Lange, a major oil field and infrastructure development joint venture centered in the North Sea. Like many large oil and gas projects, Ormen Lange is too technically and politically complex for any single partner to develop and operate all aspects of the project. Accordingly, Statoil was the lead developer of the project for the first decade, but then operatorship shifted to Royal Dutch Shell when the venture first started production.
This need to dynamically assemble capabilities begs a question: How well do JV Boards, management teams, and individual shareholders really understand the capabilities of the parties – and use this understanding to inform the overall direction, operating model, service and staffing strategies, and risk assessment of the venture?
Not very well, unfortunately.
The purpose of this note is to illustrate a how simple tool – a Capabilities Map – can be applied in existing joint ventures to address these gaps and opportunities.
Our client work suggests that when key groups have an incomplete or outdated view of capabilities, opportunities are missed, performance suffers, and risks get overlooked. In one Latin American mining venture, for example, the CEO was pushing to turnaround the company’s poor safety record, but failed on multiple occasions to exploit its shareholders’ worldclass expertise in advanced process safety technology. Similarly, in one North American financial services joint venture, the CEO renewed parent-provided IT services, even though the parent had long since fallen below third-party cost and quality standards.
On the flip side, staying apprised of capabilities opens up opportunities for shareholders to leverage the JV’s emerging talents. Such was the case with Fuji Xerox, which became more distinctive than its parents in various product and technical domains.
To understand what a Capabilities Map looks like and the benefits it creates, consider a notional Sino-American automotive joint venture in China. Originally structured as a simple market-entry JV where all technology and processes came from the foreign partner, this notional venture has grown into a billion dollar business with considerable assets, activities, and capabilities in-house.
Let’s say the JV Board and management team are contemplating a series of strategic initiatives – for instance, incorporating local customizations into parent car concepts, increasing local sourcing and supply chain management, and expanding into localized components manufacturing and assembly.
Executing successfully on these initiatives would depend on many factors, of course. An important input is understanding where needed capabilities reside today within the venture’s extended family – and where they should be built in the future to optimize the business as well as the commercial and strategic interests of shareholders. A Capabilities Map would be the perfect tool for a JV CEO and Board to have this discussion in an integrated way. Done well, a Capabilities Map might list 30 or 40 core capabilities down the left side, and then, using various quantitative and qualitative inputs, rate the capability levels of the venture, each shareholder, and third party providers across the columns to the right (Exhibit 1). Darker colors indicate areas of relative strength; lighter colors indicate areas of relative weakness.
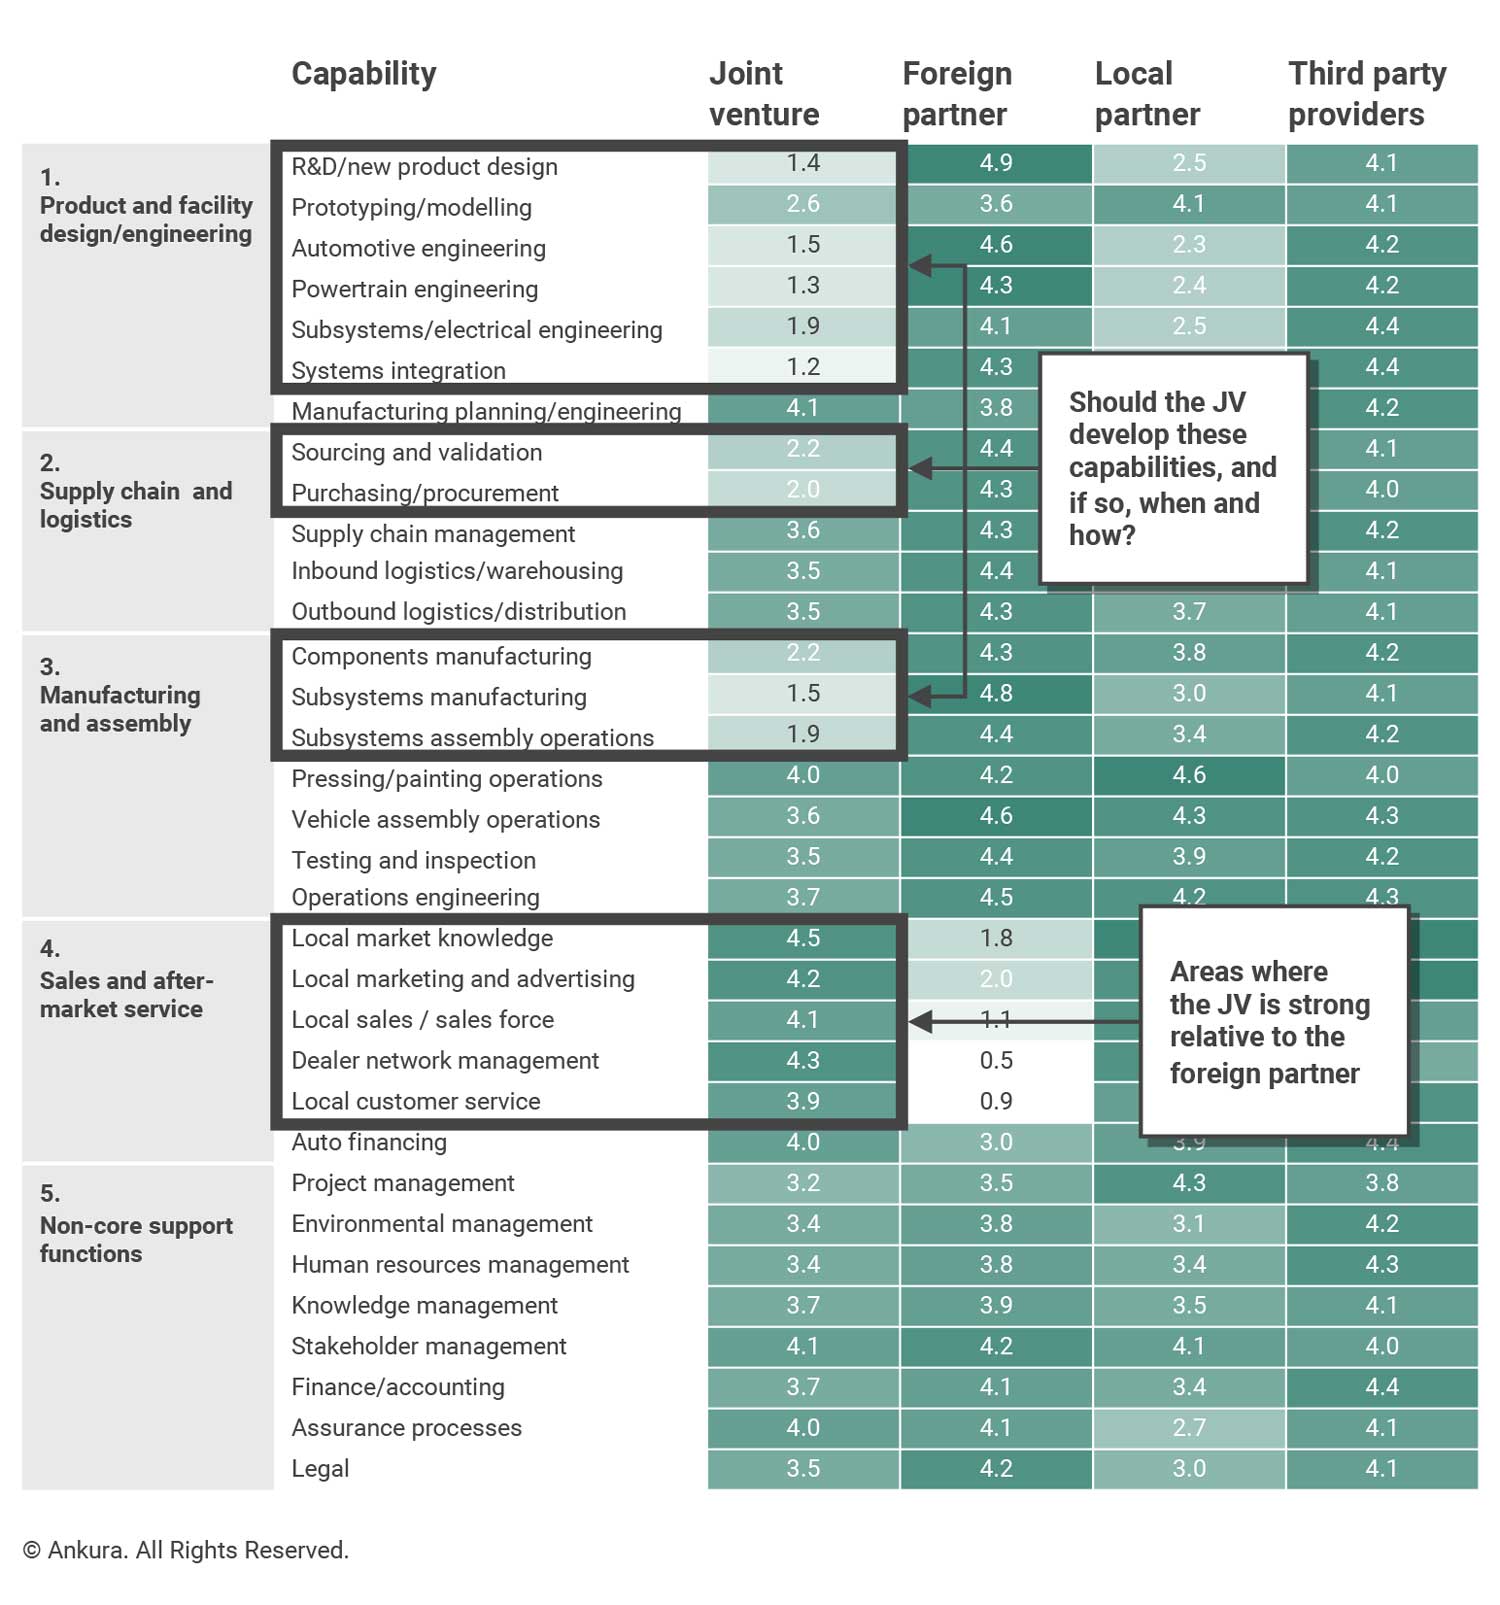
For example, the Capabilities Map might show that the JV has significant capability gaps across product/facility design and engineering – an area where it currently relies heavily on its foreign partner to provide capabilities through long-term technical service and licensing agreements – as well as within sub-functions of suppy chain management and logistics. In contrast, the JV is quite strong in sales and after-market service – an area that it has built up over the last decade.
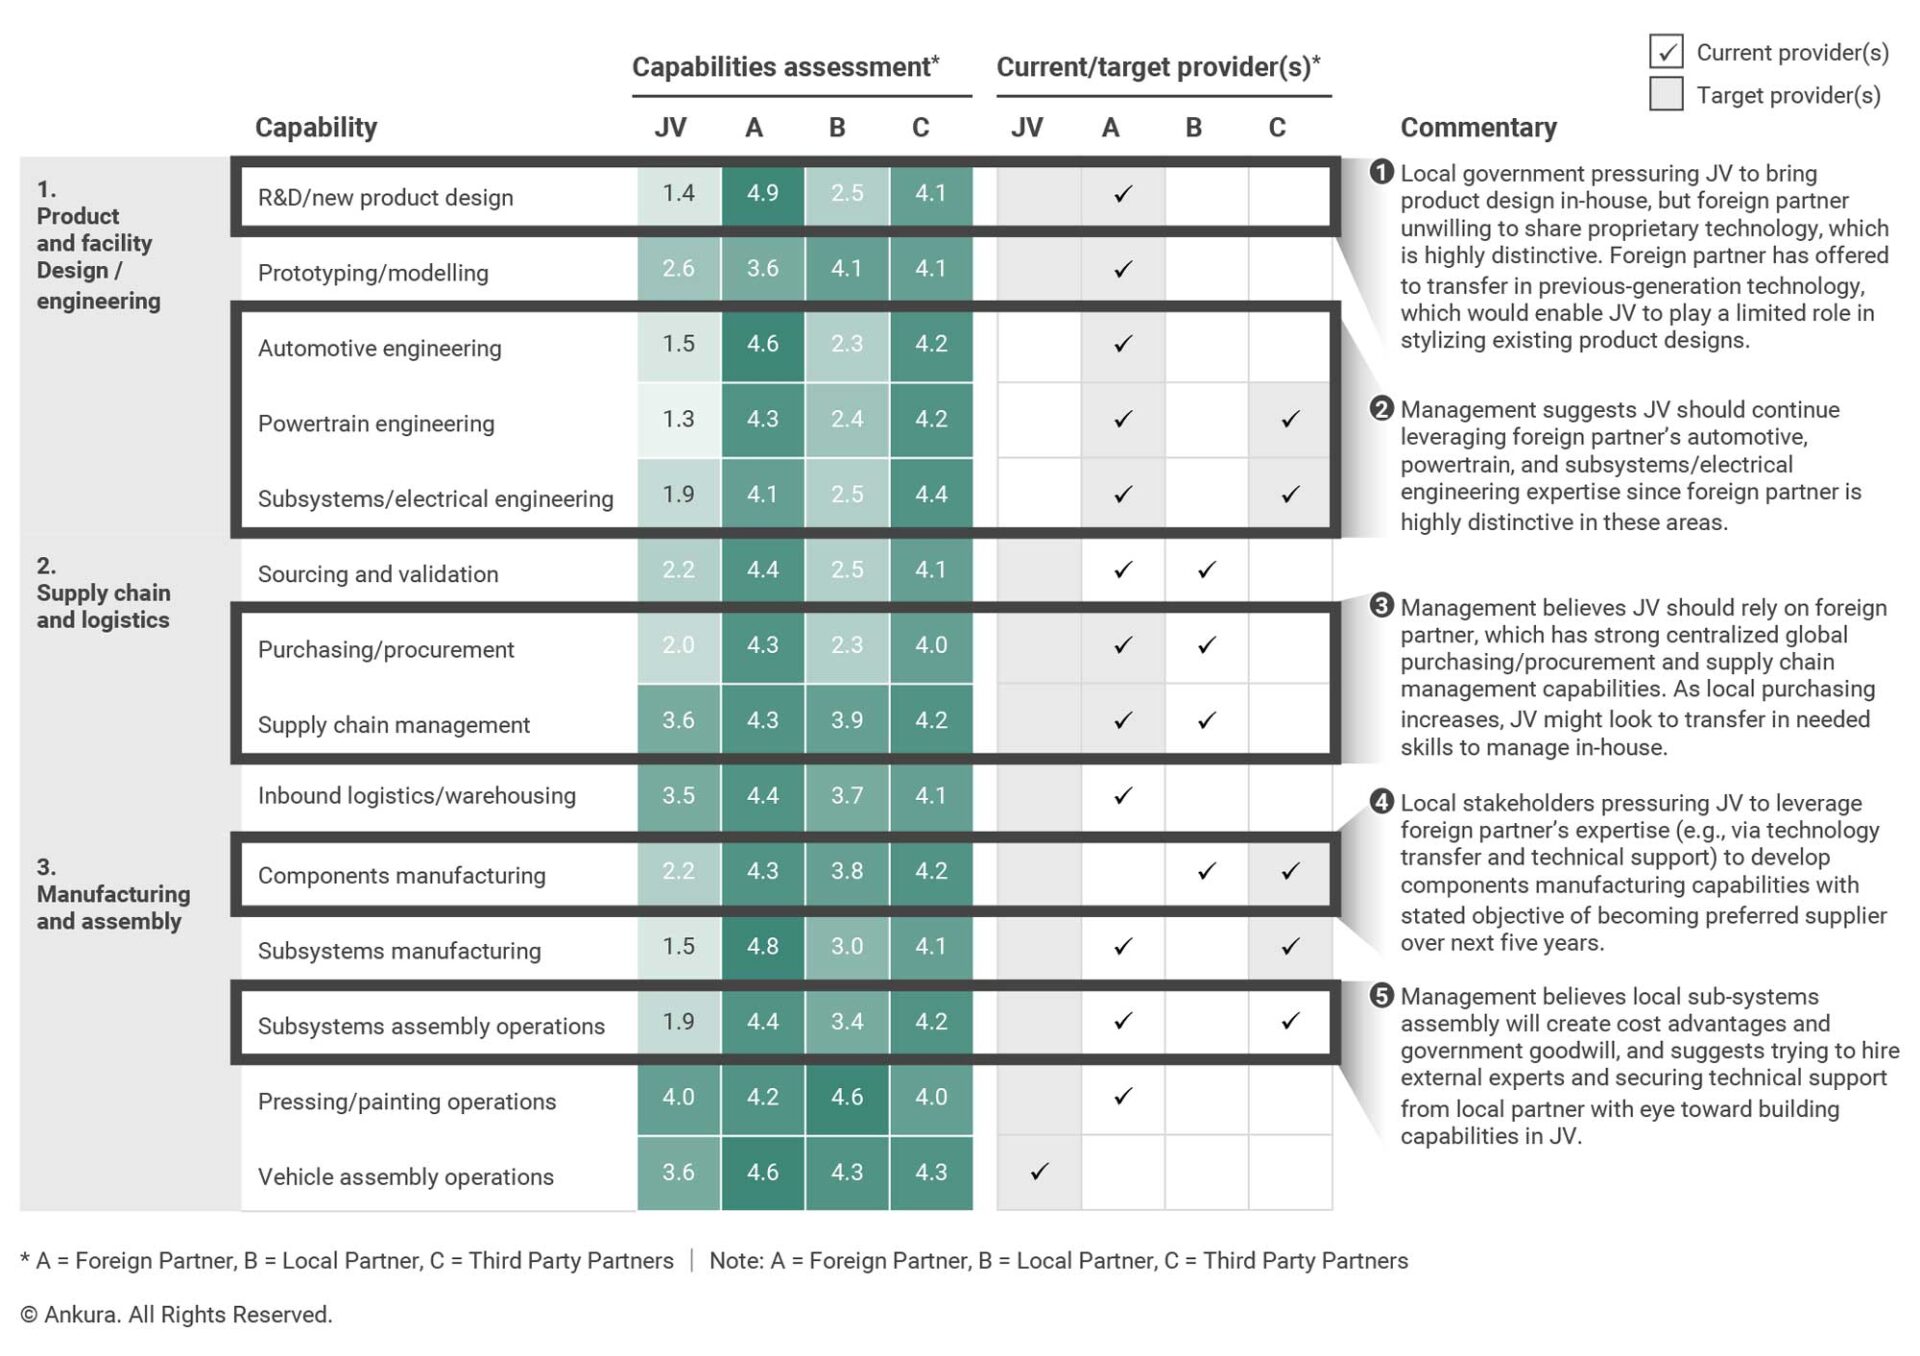
To inform a strategic planning discussion, the Board or management team might create an expanded version of the Capabilities Map that includes not just ratings of each parties’ capabilities, but also indicates the current and target provider of each capability. This expanded Capabilities Map adds commentary on how the venture might address current gaps, how the venture might manage the desired migration, and how all of this impacts the proposed strategic initiatives (Exhibit 2).
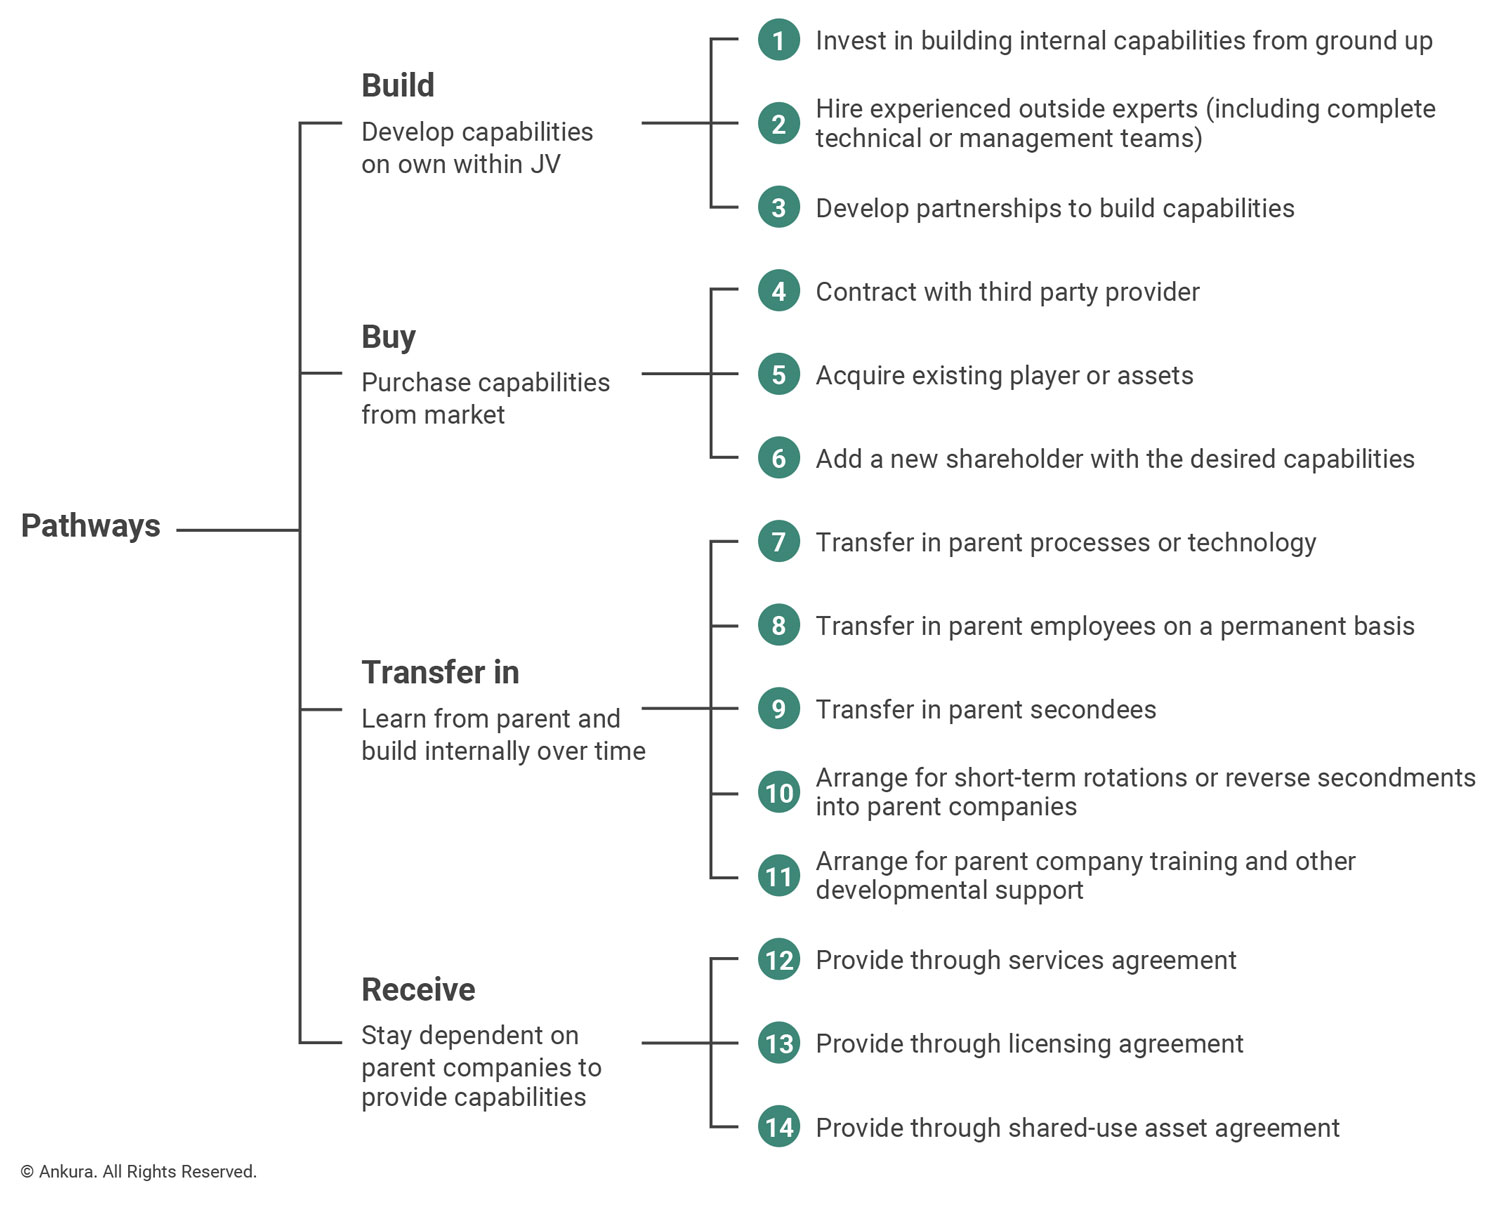
In general, a JV has several different pathways to secure capabilities where gaps exist (Exhibit 3). At the highest level, it can be useful to think about a build-buy-transfer-receive framework, where “build” means the venture develops the capabilities on its own through in-house investments; “buy” means the venture taps into the third-party market through contracting arrangements, acquisitions, and partnerships; “transfer in” means the venture leverages one or more of its parent companies to provide the capability or to transfer in skills; and “receive” means the venture elects to stay dependent on one or more parent companies, who are distinctive in their capabilities.
 s to Access Needed Capabilities" loading="lazy" >
Each pathway then contains different mechanisms through which capabilities could be accessed. For example, within “build,” a joint venture might invest in building capabilities from the ground up, hire experienced experts from the market (including an entire management or technical team), or develop strategic partnerships to unlock new capabilities. Notably, these pathways and mechanisms are not mutually exclusive. In fact, at any given time, the venture may be accessing specific capabilities through multiple mechanisms within the different pathways.
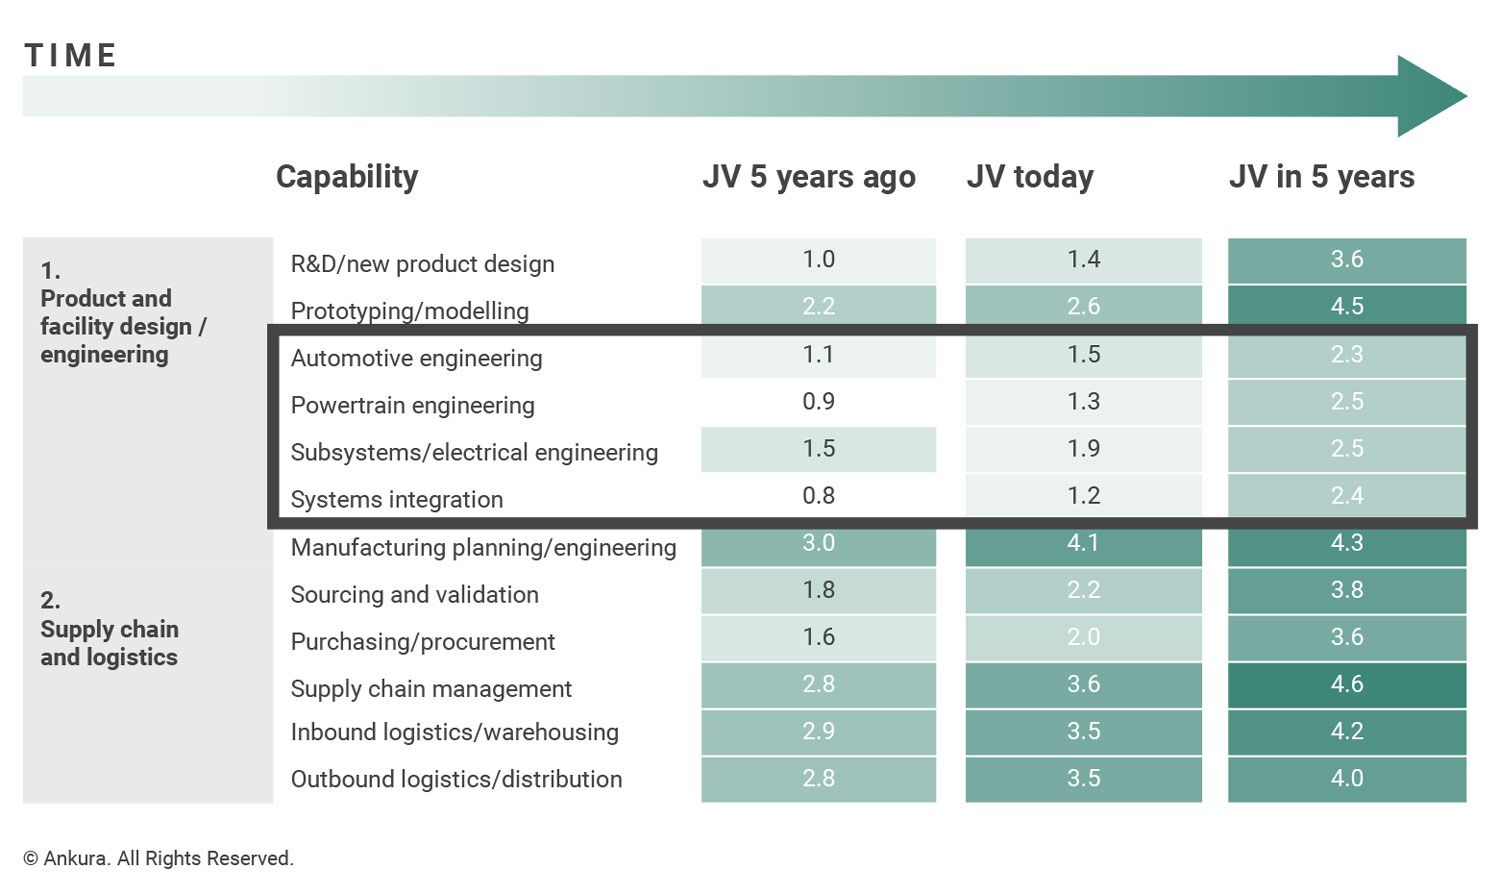
This brings us to another common use of the Capabilities Map: To serve as the basis for a broader discussion about venture evolution – specifically, where the venture depends on capabilities today, and where the venture should seek greater independence over time (Exhibit 4). For example, it may be the ambition of the JV Board and management to vertically integrate into higher value-added activities such as vehicle engineering (i.e., automotive, powertrain, and subsystems/electrical engineering, as well as systems integration). However, given the current learning curve, and the current rate of technology transfer, the Capabilities Map shows that the JV would not have the requisite capability levels to take over for parent companies and compete with third-party providers. Something more would be needed. If the JV is intent on developing engineering capabilities, and parents are unwilling to transfer such capabilities, the Capabilities Map might lead the JV Board and management team to explore more progressive options, such as acquiring a mature foreign competitor. In other areas, such as purchasing and procurement and supply chain management, the Capabilities Map shows a different calculus whereby the JV fully expects to attain parent-comparable capabilities over the coming five years. This would help the JV Board and management plan a gradual migration from parent-led sourcing, to a mixed approach where the parent handles global sourcing and the JV handles local sourcing.
A Capabilities Map is also useful for individual shareholder governance teams (also known as “asset teams,” especially in natural resources industries). To understand how one such team applied it, consider the experience of a major oil company that had recently acquired a minority, non-operated position in a midstream joint venture operating company (JV OPCO). During its first year as an owner of the asset, the shareholder team developed a Capabilities Map, leveraging historical performance data from the asset, and consulting with functional experts inside the company that had been part of the due diligence review, and had participated in shareholder audits and site visits. The team also talked to industry consultancies to understand the capabilities of the other shareholders.
Armed with this input, the shareholder governance team developed a draft Capabilities Map (Exhibit 5). The map included summary scores for the venture and each shareholder – as well a commentary column that summarized whether the JV operating company could benefit from the support of one of its shareholders. The Capabilities Map also indicated how receptive the JV management team and other stakeholders might be for such support.
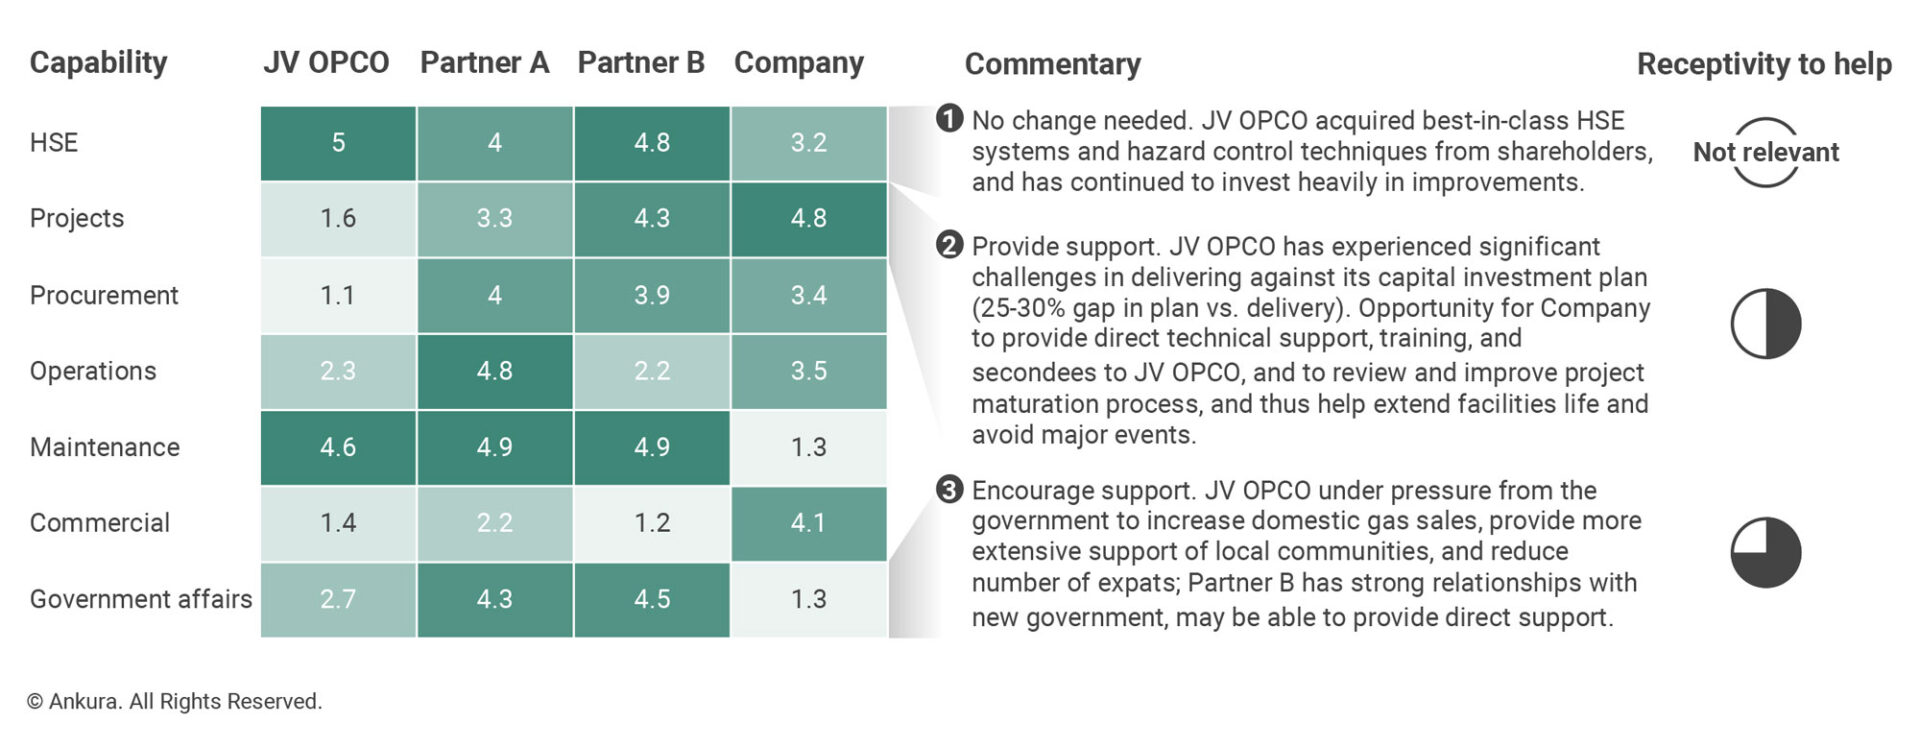
For example, the map shows that the JV operating company has poor capabilities in capital project management, while the Company is quite advanced in this area. The half moon to the right of the ratings signifies that the JV operating company is also moderately open to receiving support from shareholders in fulfilling these duties, if rubbed the right way. The adjacent commentary captures the governance teams proposed approach to engaging Partners A and B on this issue.
The draft Capabilities Map was further refined in a half-day working session of the shareholder team, where this was a critical input into developing the Annual Influencing Plan. The plan linked certain capability gaps to specific Key Focus Areas, and related target outcomes and workplans. Beyond that, the Capabilities Map also became a standard end product in quarterly business reviews of the asset.
Beyond the specifics of the two above examples, JV CEOs, Boards, and shareholder governance teams should keep in mind the following when developing and using a Partner Capabilities Map:
A Capabilities Map is a simple but versatile tool, one of a handful of key lenses through which the shareholders and management teams should regularly look to understand how a venture is doing. The potential uses differ somewhat for JV Boards and management teams compared to individual shareholders governance teams (Exhibit 6).
© Ankura. All Rights Reserved.
Chances are that your company will overrate its own capabilities, base the rating on an outdated view, or fail to factor in third-party providers, who may well have better capabilities at a lower price than either partner. It is also common for companies to not adequately consider their ability to actually deliver the needed capabilities to the venture (i.e., honestly and accurately answer the question: Can we really get our best people to go into or support the venture, given our inherent bias to prioritize support to wholly-owned or company-controlled businesses?). To overcome this inherent ratings bias, it can be useful to: (i) get outside opinions (e.g., views from industry analysts, suppliers, and business partners of the company); and (ii) rely on data, not just opinions (e.g., industry benchmarks on operating performance, costs, number of patents).
In most cases, capabilities are found in specific individuals, not companies. Consider this in a dealmaking context. As high-value skills are identified in a Capabilities Map, dealmakers should be thinking about whether to negotiate deal terms that make that linkage explicit (e.g., named individuals to be seconded into key managerial or technical positions, key staffing provisions where investment activity is halted if certain employees cannot commit a required level of time to the partnership) or whether to structure financial incentives or penalties based on whether the counterparty delivers those critical capabilities or not.
Mapping capabilities won’t always get you through the woods, but it can help inform strategic, commercial, governance and management decisions when directions are not clear. Chart a course for success: Map those capabilities.
We understand that succeeding in joint ventures and partnerships requires a blend of hard facts and analysis, with an ability to align partners around a common vision and practical solutions that reflect their different interests and constraints. Our team is composed of strategy consultants, transaction attorneys, and investment bankers with significant experience on joint ventures and partnerships – reflecting the unique skillset required to design and evolve these ventures. We also bring an unrivaled database of deal terms and governance practices in joint ventures and partnerships, as well as proprietary standards, which allow us to benchmark transaction structures and existing ventures, and thus better identify and build alignment around gaps and potential solutions. Contact us to learn more about how we can help you.
Comments